The PlayDistrict Chatbot: Family Events Finder
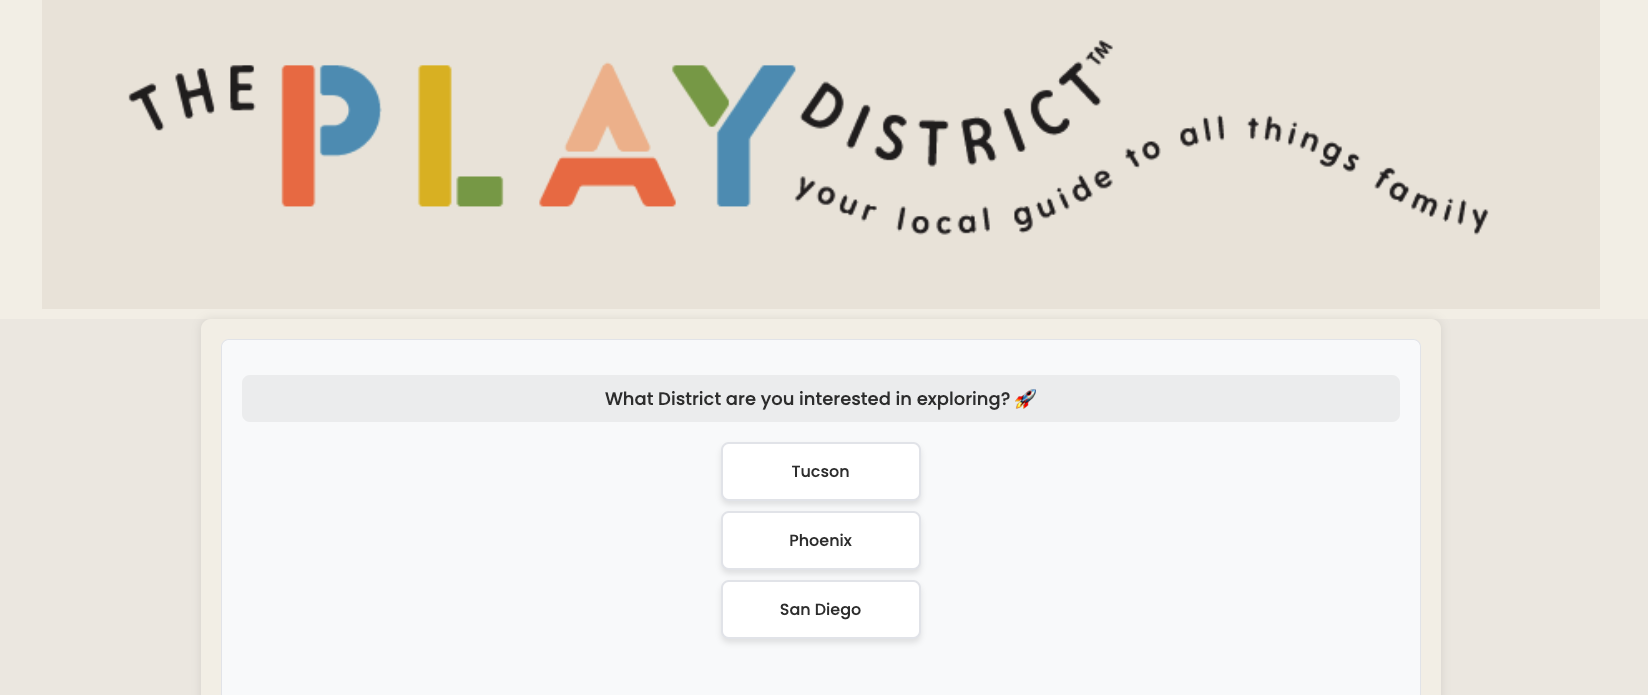
Experience a seamless way to explore family events in Tucson, Phoenix, and San Diego with The PlayDistrict Chatbot. This innovative platform combines AI-driven technologies with user-friendly designs to deliver tailored event recommendations for families.
Key features of the PlayDistrict Chatbot:
- Interactive chatbot interface for dynamic conversations and personalized recommendations.
- Real-time event data integration and retrieval based on user-selected cities.
- Responsive design optimized for mobile and desktop devices.
- Machine Learning models for understanding user preferences and improving event suggestions.
- Dynamic user experience with custom animations and error-handling mechanisms.
This project demonstrates expertise in full-stack development, data integration, and user-centric design, providing an engaging solution for discovering family events.
Sustainable Future: Energy Efficiency and Emissions Analysis
Embark on a journey towards a greener future with this comprehensive Tableau dashboard focused on energy efficiency and emissions analysis. This powerful visualization tool provides a detailed look at the environmental landscape across different regions, offering invaluable insights for sustainability initiatives and policy-making.
Key aspects of this analysis include:
- Geospatial mapping of energy consumption patterns and emission hotspots
- Comparative analysis of waste generation and recycling rates across regions
- Trend analysis of renewable energy adoption and its impact on overall emissions
- Identification of areas with high potential for sustainability improvements
- Predictive modeling for future energy efficiency scenarios
This dashboard serves as a crucial resource for environmental scientists, urban planners, and policymakers, providing the data-driven insights needed to shape effective strategies for a sustainable future. By highlighting areas of concern and opportunity, it paves the way for targeted interventions and informed decision-making in the ongoing battle against climate change.
Cryptocurrency Impact on PC Components: An Interactive Dashboard
Dive into the fascinating world of cryptocurrency's influence on the PC hardware market with this comprehensive Power BI dashboard. This project meticulously analyzes the intricate relationship between cryptocurrency price trends, focusing on major players like Bitcoin and Ethereum, and their ripple effects on GPU pricing and availability.
Key features of this dashboard include:
- Real-time correlation analysis between crypto prices and GPU market dynamics
- Interactive filters for in-depth exploration of specific processors and time periods
- Visual representations of supply-demand fluctuations in the GPU market
- Predictive insights on potential market trends based on historical data
This tool is invaluable for tech enthusiasts, market analysts, and decision-makers in the PC hardware industry, offering a data-driven approach to understanding and anticipating market shifts influenced by the volatile world of cryptocurrencies.
Sales Forecasting for Pharmaceutical Products Using Databricks
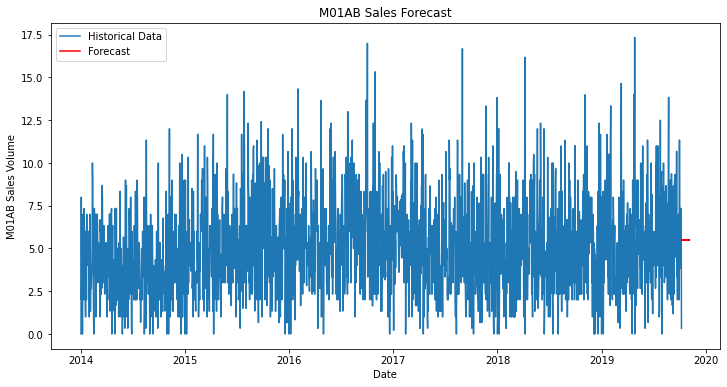
This project demonstrates the development of a sales forecasting model for pharmaceutical products using advanced analytics and machine learning techniques within the Databricks platform. Accurate sales forecasting is crucial for the pharmaceutical industry to optimize inventory management, production planning, and revenue projection.
Key features of this project include:
- Data Cleaning: Handles missing values, inconsistent formats, and outliers.
- Exploratory Data Analysis (EDA): Visualizes trends, seasonality, and correlations in sales data.
- Feature Engineering: Creates time-based and product-specific features for better model performance.
- Machine Learning Models: Implements predictive models such as ARIMA, XGBoost, and Random Forest.
- Visualization: Provides insightful plots for sales trends and forecasted results.
This project offers valuable insights for businesses seeking to improve sales forecasting accuracy and optimize resource planning.
Road Safety Revolution: Arizona Accidents Analysis 2016-2020
Embark on a comprehensive journey through Arizona's traffic safety landscape with this cutting-edge Tableau dashboard. This project offers an in-depth analysis of traffic accidents across the state from 2016 to 2020, providing crucial insights for enhancing road safety and reducing accident rates.
Key features of this analysis include:
- Interactive heat maps highlighting high-risk zones and accident hotspots
- Temporal analysis showing accident patterns by time of day, day of week, and seasonality
- Correlation studies between weather conditions and accident frequency
- Detailed breakdown of accident types, including DUI incidents
- Trend analysis for identifying long-term patterns and emerging risk factors
This powerful tool is designed to support data-driven decision-making for traffic authorities, urban planners, and public safety officials. By providing a clear, visual representation of accident data, it enables targeted interventions, resource allocation, and policy formulation to significantly enhance road safety across Arizona.
Customer Churn Prediction for a Telecom Company
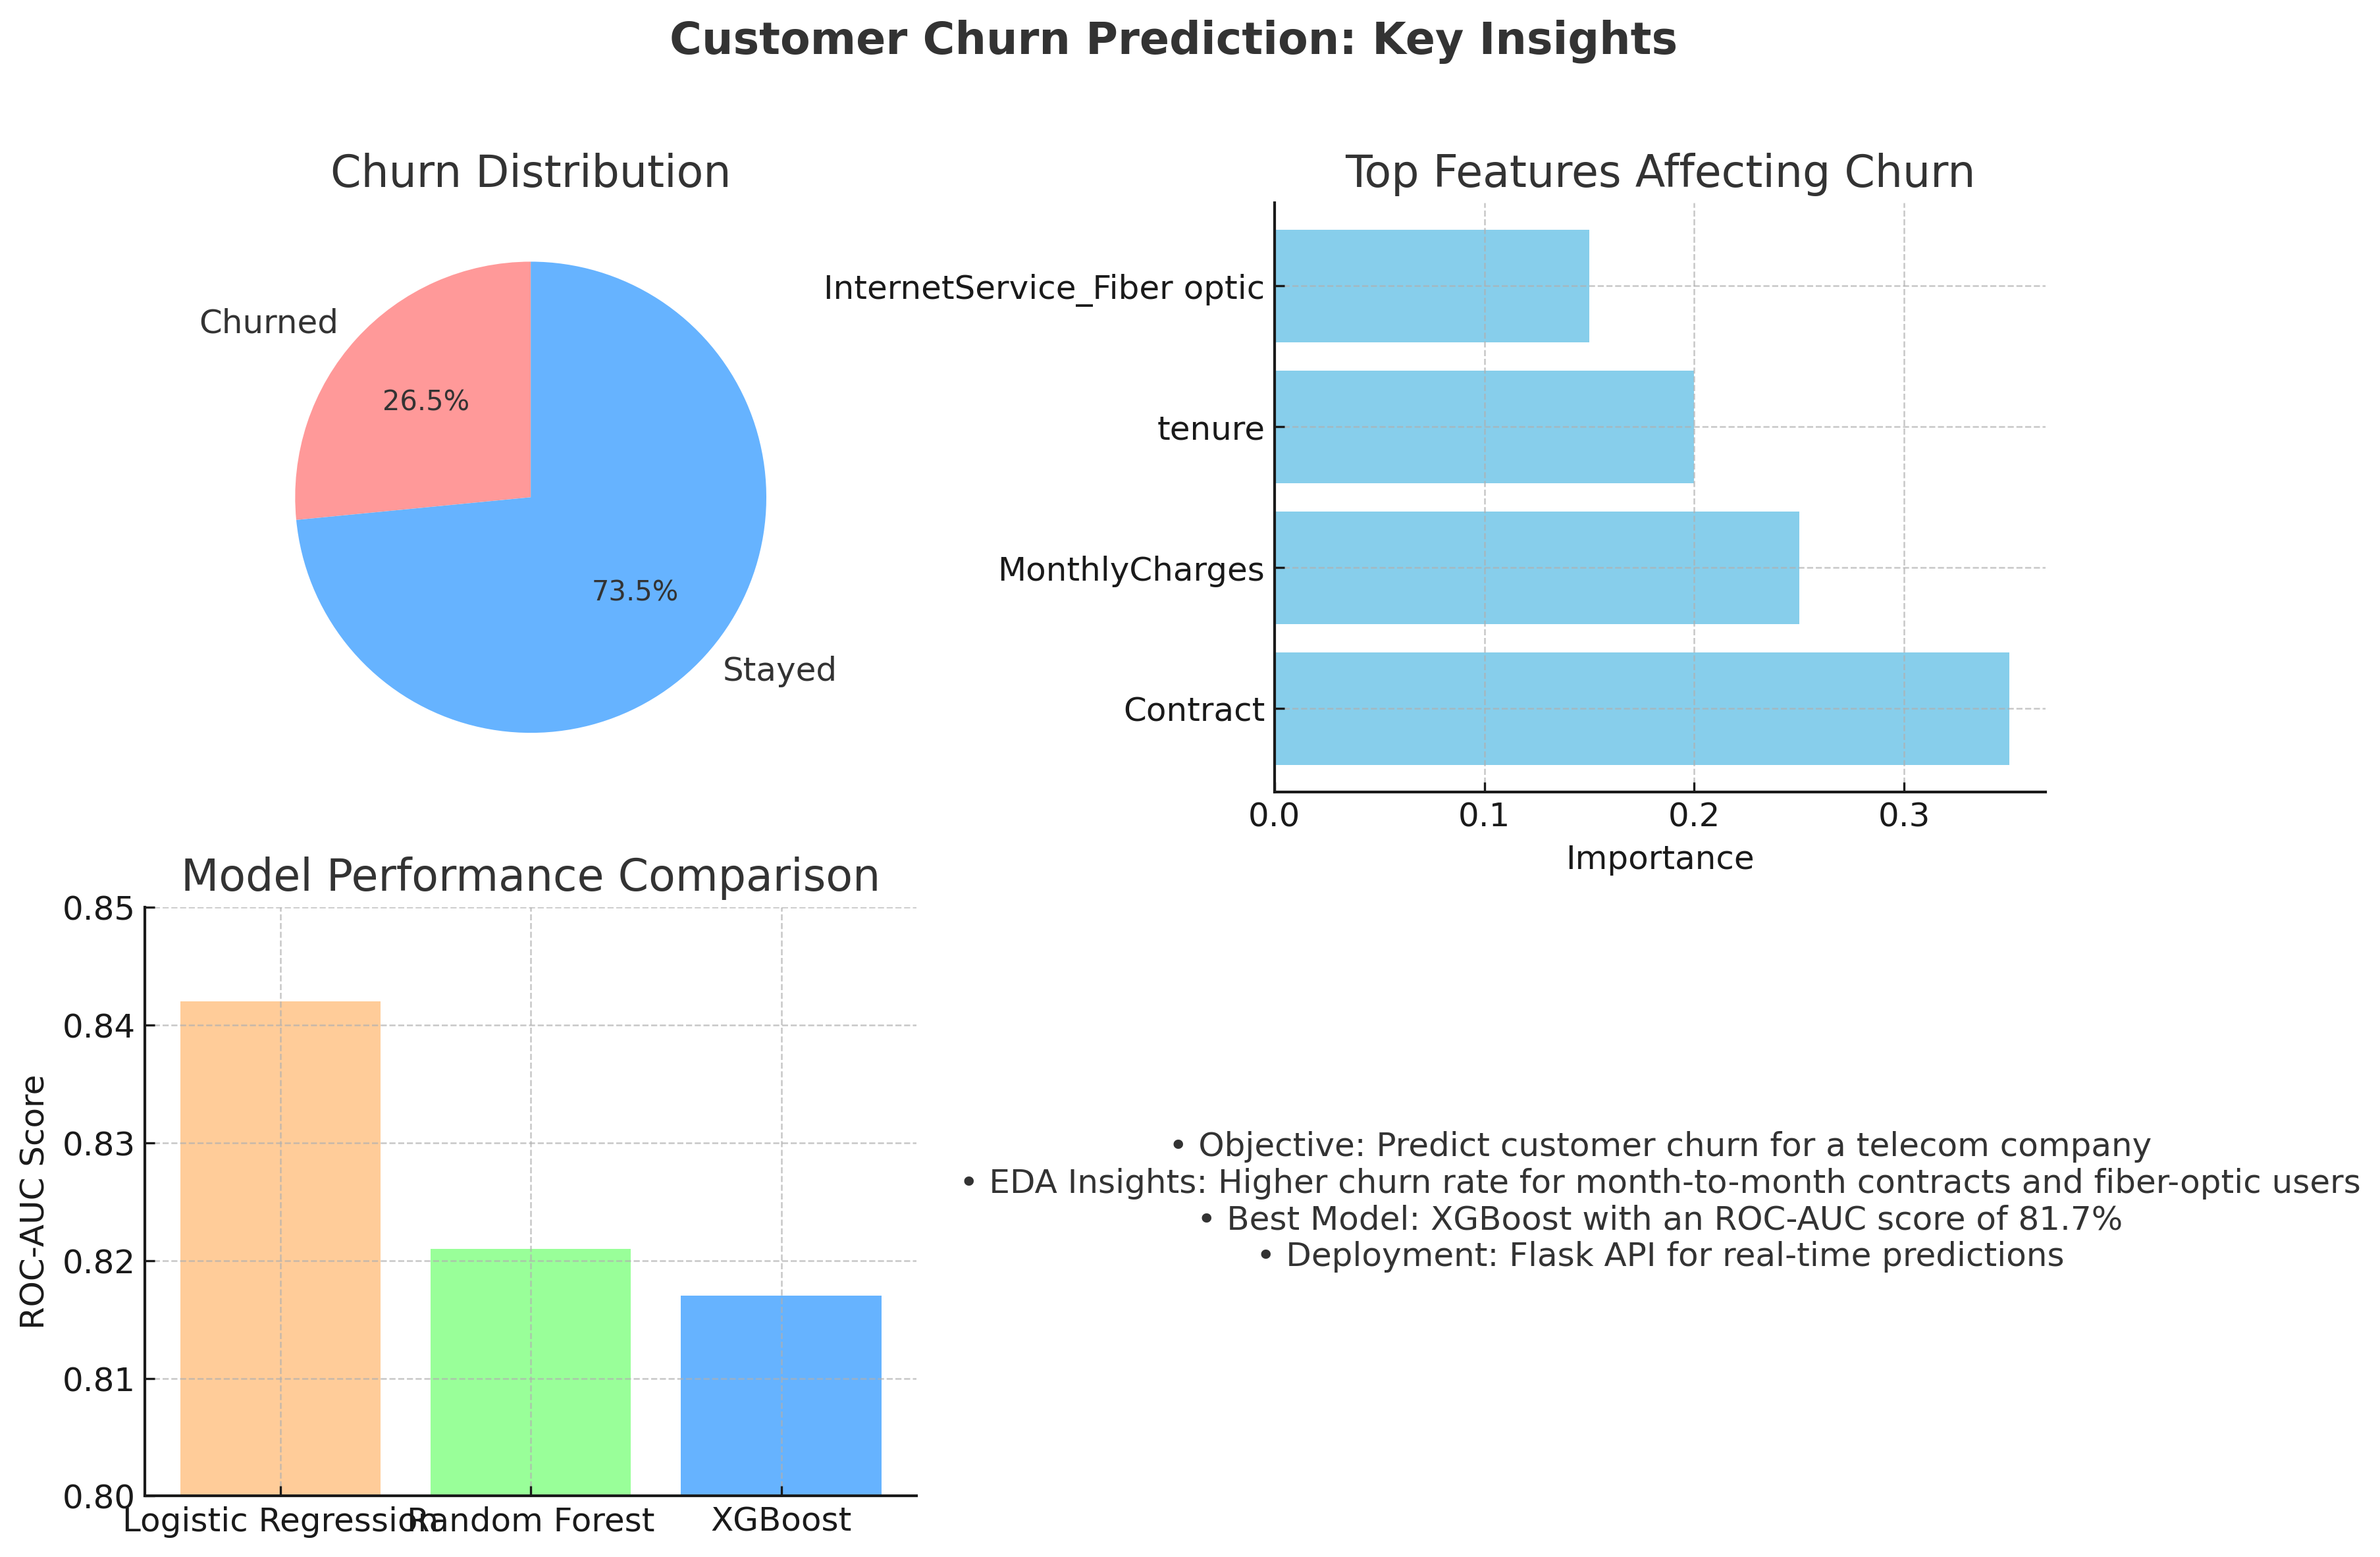
Predict customer churn using machine learning models to help a telecom company identify at-risk customers and implement retention strategies. The project leverages Logistic Regression, Random Forest, and XGBoost models, with the highest accuracy achieved using XGBoost.
Key highlights of the project:
- Data preprocessing: Handled missing values, encoded categorical features, and scaled numerical features.
- Exploratory Data Analysis: Identified key patterns such as the high churn rate for month-to-month customers and users with fiber optic internet.
- Model performance: XGBoost model achieved an ROC-AUC score of 81.7%.
- Model Deployment: The final model was deployed using Flask with a REST API endpoint for real-time predictions.
This project offers valuable insights for businesses seeking to reduce customer churn and enhance retention strategies.
Classifying At-Risk COVID-19 Patients Using Machine Learning
This project focuses on building a machine learning model to predict the mortality risk of COVID-19 patients. By leveraging supervised learning techniques, the model aims to identify high-risk patients, enabling timely interventions to save lives and optimize healthcare resources.
Key features of this project include:
- Comprehensive data cleaning and preprocessing, including handling missing values, standardizing binary variables, and normalizing numerical features.
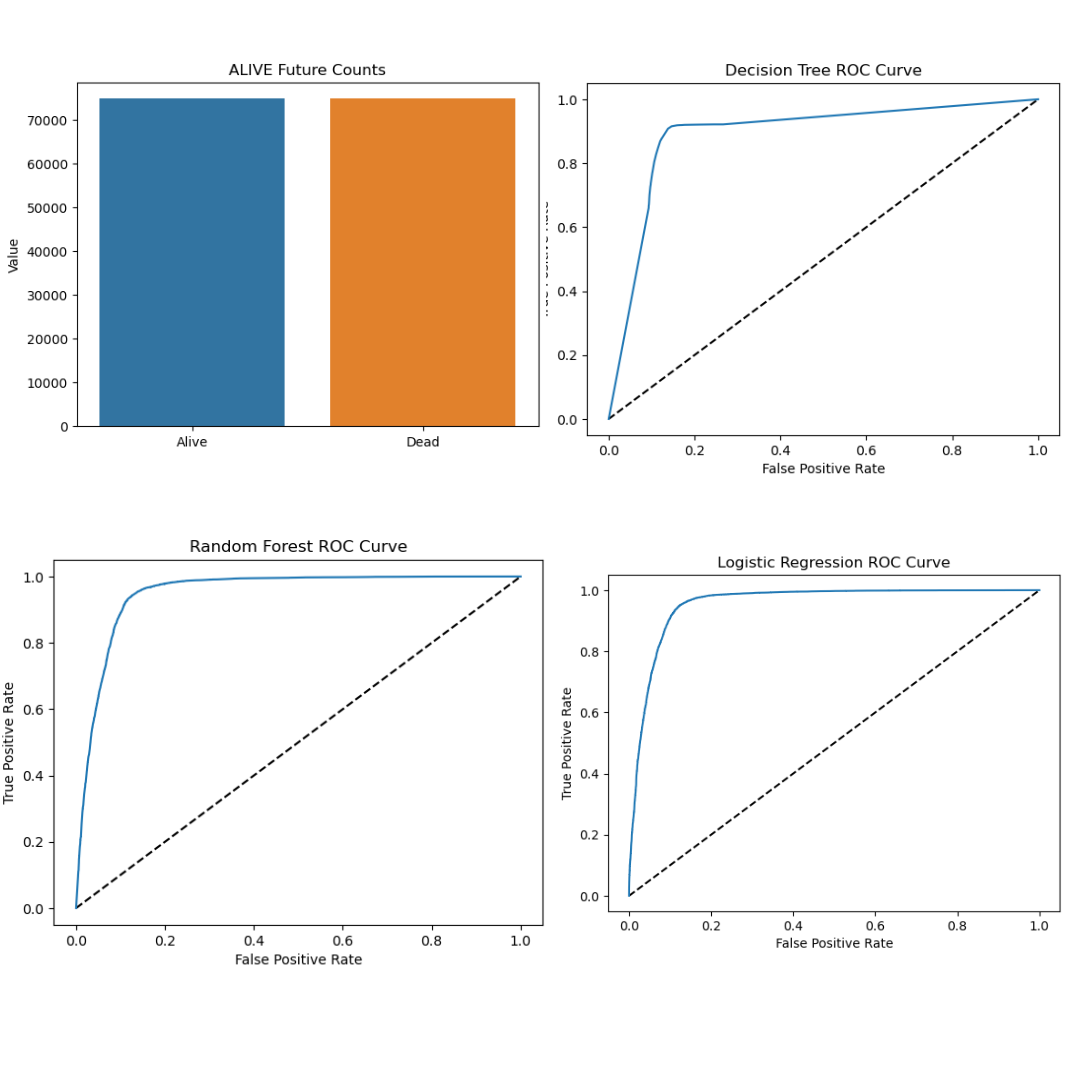
- Application of multiple supervised learning models: logistic regression, K-nearest neighbors (KNN), Naive Bayes, decision tree, and random forest.
- Comparative model evaluation to identify the best-performing algorithm.
- Visualization of key findings for interpretability and decision-making.
This project provides actionable insights for healthcare providers to prioritize resources and design targeted intervention strategies.
Professional Experience
Data Analyst | BI Analyst | AI Engineer | Consultant
Sept 2024 - Present
The Play District · Tucson, AZ
• Built an analytics pipeline to extract, transform, and visualize user data trends, improving chatbot engagement rates by 25%
• Engineered NLP-based models for chatbot optimization, increasing response accuracy and user satisfaction by 30%
• Designed real-time SQL dashboards to monitor key performance metrics, aiding data-driven decisions across business teams
• Implemented machine learning algorithms to analyze customer behavior patterns, leading to a 40% improvement in user retention
• Developed and maintained ETL processes using Python and SQL, ensuring data accuracy and consistency across platforms
• Created automated reporting systems in Power BI and Tableau, reducing manual reporting time by 60%
• Collaborated with cross-functional teams to implement AI-driven solutions for customer engagement and feedback analysis
• Conducted A/B testing on UI/UX improvements, resulting in a 35% increase in user interaction time
• Led the development of predictive analytics models to forecast user engagement trends with 85% accuracy
Skills: Python • SQL • NLP • Machine Learning • Data Analytics • Power BI • Tableau • ETL • A/B Testing • Statistical Analysis • Predictive Modeling
Student Software Engineer
Sep 2024 - Present
The University of Arizona's Institute for Computation & Data Enabled Insight · Part-time · Tucson, Arizona
• Developed and maintained RESTful APIs using Node.js and Express, improving data retrieval efficiency by 40%
• Implemented automated testing frameworks reducing bug detection time by 60%
• Collaborated with research teams to build data visualization tools using D3.js and React
• Optimized database queries and implemented caching solutions, reducing response times by 35%
• Participated in agile development cycles, contributing to sprint planning and daily standups
• Created comprehensive API documentation improving team collaboration efficiency
• Integrated continuous integration/deployment pipelines using Jenkins and Docker
• Debugged and resolved complex software issues, maintaining 99.9% system uptime
Skills: Node.js • React.js • Express • REST APIs • SDLC • Amazon Redshift • MongoDB • SQL • Git • Jenkins • Docker • Jira • Agile Development
AI Engineer
Mar 2024 - Sep 2024
The University of Arizona, Institute for Computation & Data-Enabled Insight, AI Core · Tucson
• Architected the RAG system using Langchain and LlamaIndex, improving data retrieval accuracy by 25%
• Integrated LLM with customer data to drive strategic insights for university research initiatives
• Coordinated cross-functional collaborations with IT and data science teams, reducing cloud costs by 30%
• Optimized model training processes, improving efficiency by 40% and reducing predictive errors
• Mentored junior engineers and interns, fostering innovation through effective leadership
Skills: Azure • Neural Networks • AWS • SDLC • NLP • LLMs • Node.js • Cloud Computing • SQL • Databases • Python • ETL • React.js • RAG
Data Assistant / Graduate Student Worker
Oct 2023 - Sep 2024
University of Arizona College of Medicine – Tucson
• Managed monthly data uploads for UofA HIV Programs with 99% accuracy rate
• Led data source optimization initiatives, streamlining retrieval and reporting processes
• Employed business analysis tools to optimize processes and improve asset management
• Leveraged Stata for comprehensive data analysis and visualization
• Communicated complex data findings clearly to diverse stakeholders
Skills: Project Management • Data Analytics • Data Analysis • Databases • Administration • Stata
Business Analyst
Oct 2021 - Apr 2023
Onin Corporation (OPC) · Hyderabad, India
• Managed product lifecycle, optimizing operations and improving performance by 15%
• Developed marketing strategies resulting in 25% increase in sales and engagement
• Conducted data analysis using SQL, R, and Python for key business decisions
• Developed automated dashboards for real-time KPI tracking
• Conducted A/B tests to optimize customer journeys and increase conversion rates
• Provided analytical support leading to 10% increase in customer retention
Skills: Data Visualization • VBA Excel • Azure • Financial Analysis • R • SQL • Data Analytics • Technical Product Management • Agile • Python • Tableau
Previous Experience
2019
• Outgoing Global Entrepreneur at AIESEC India (Jul - Nov 2019)
• Sales Executive at Offerwaale (Feb - Jun 2019): Secured 50 new partnerships and achieved 25% growth


